
Fisheries Technology
COMB combines fish biology concepts with new technology, and uses that information to support, preserve and enhance fish habitat along the Santa Ynez River.
GIS
GIS is computer software that integrates and displays complex environmental data to provide better, more efficient river management. The Santa Ynez River watershed is 90 miles long. It contains many streams and some natural and man made features that impact fish. A constant flow of data-fish size, counts, locations, stream flow, rainfall, water temperature, and more-have been recorded over the last two decades. Until recently, biologists struggled to efficiently integrate and analyze the large volume of information. GIS links spatial data with other information to provide useful visual information and analytical aids to understanding complex river systems. Using GIS, biologists can collect, analyze and merge large amounts of data to develop a better understanding of steelhead habitat. This improves our ability to develop more cost-effective programs that benefit fish and the environment.
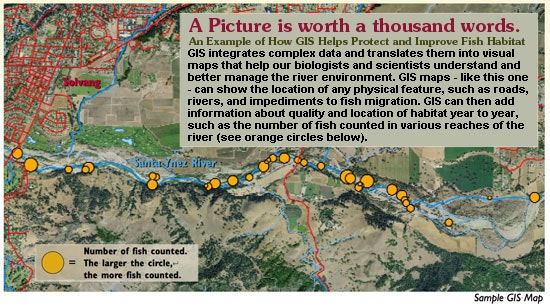
Biologists and scientists obtain data through trapping, measuring, snorkeling and observing fish. Many additional types of data are integrated, such as water quality, land use, roads, property boundaries and elevations to create useful visual images like the sample GIS map above.
GPS
Handheld GPS technology has been used in the fisheries program for over a decade. The accuracy of GPS has vastly improved over recent years with the addition of many more satellites in the sky and better on-the-ground equipment. COMB's GPS device, a Trimble GeoXH can be programmed for an accuracy of less than a centimeter when post-processing has occurred. This is quite a departure from the standard GPS units that have accuracies anywhere from 20 to 40 feet. This new Trimble unit is particularly useful when collecting detailed information in and around fish passage barriers, where higher accuracy measurements are needed.
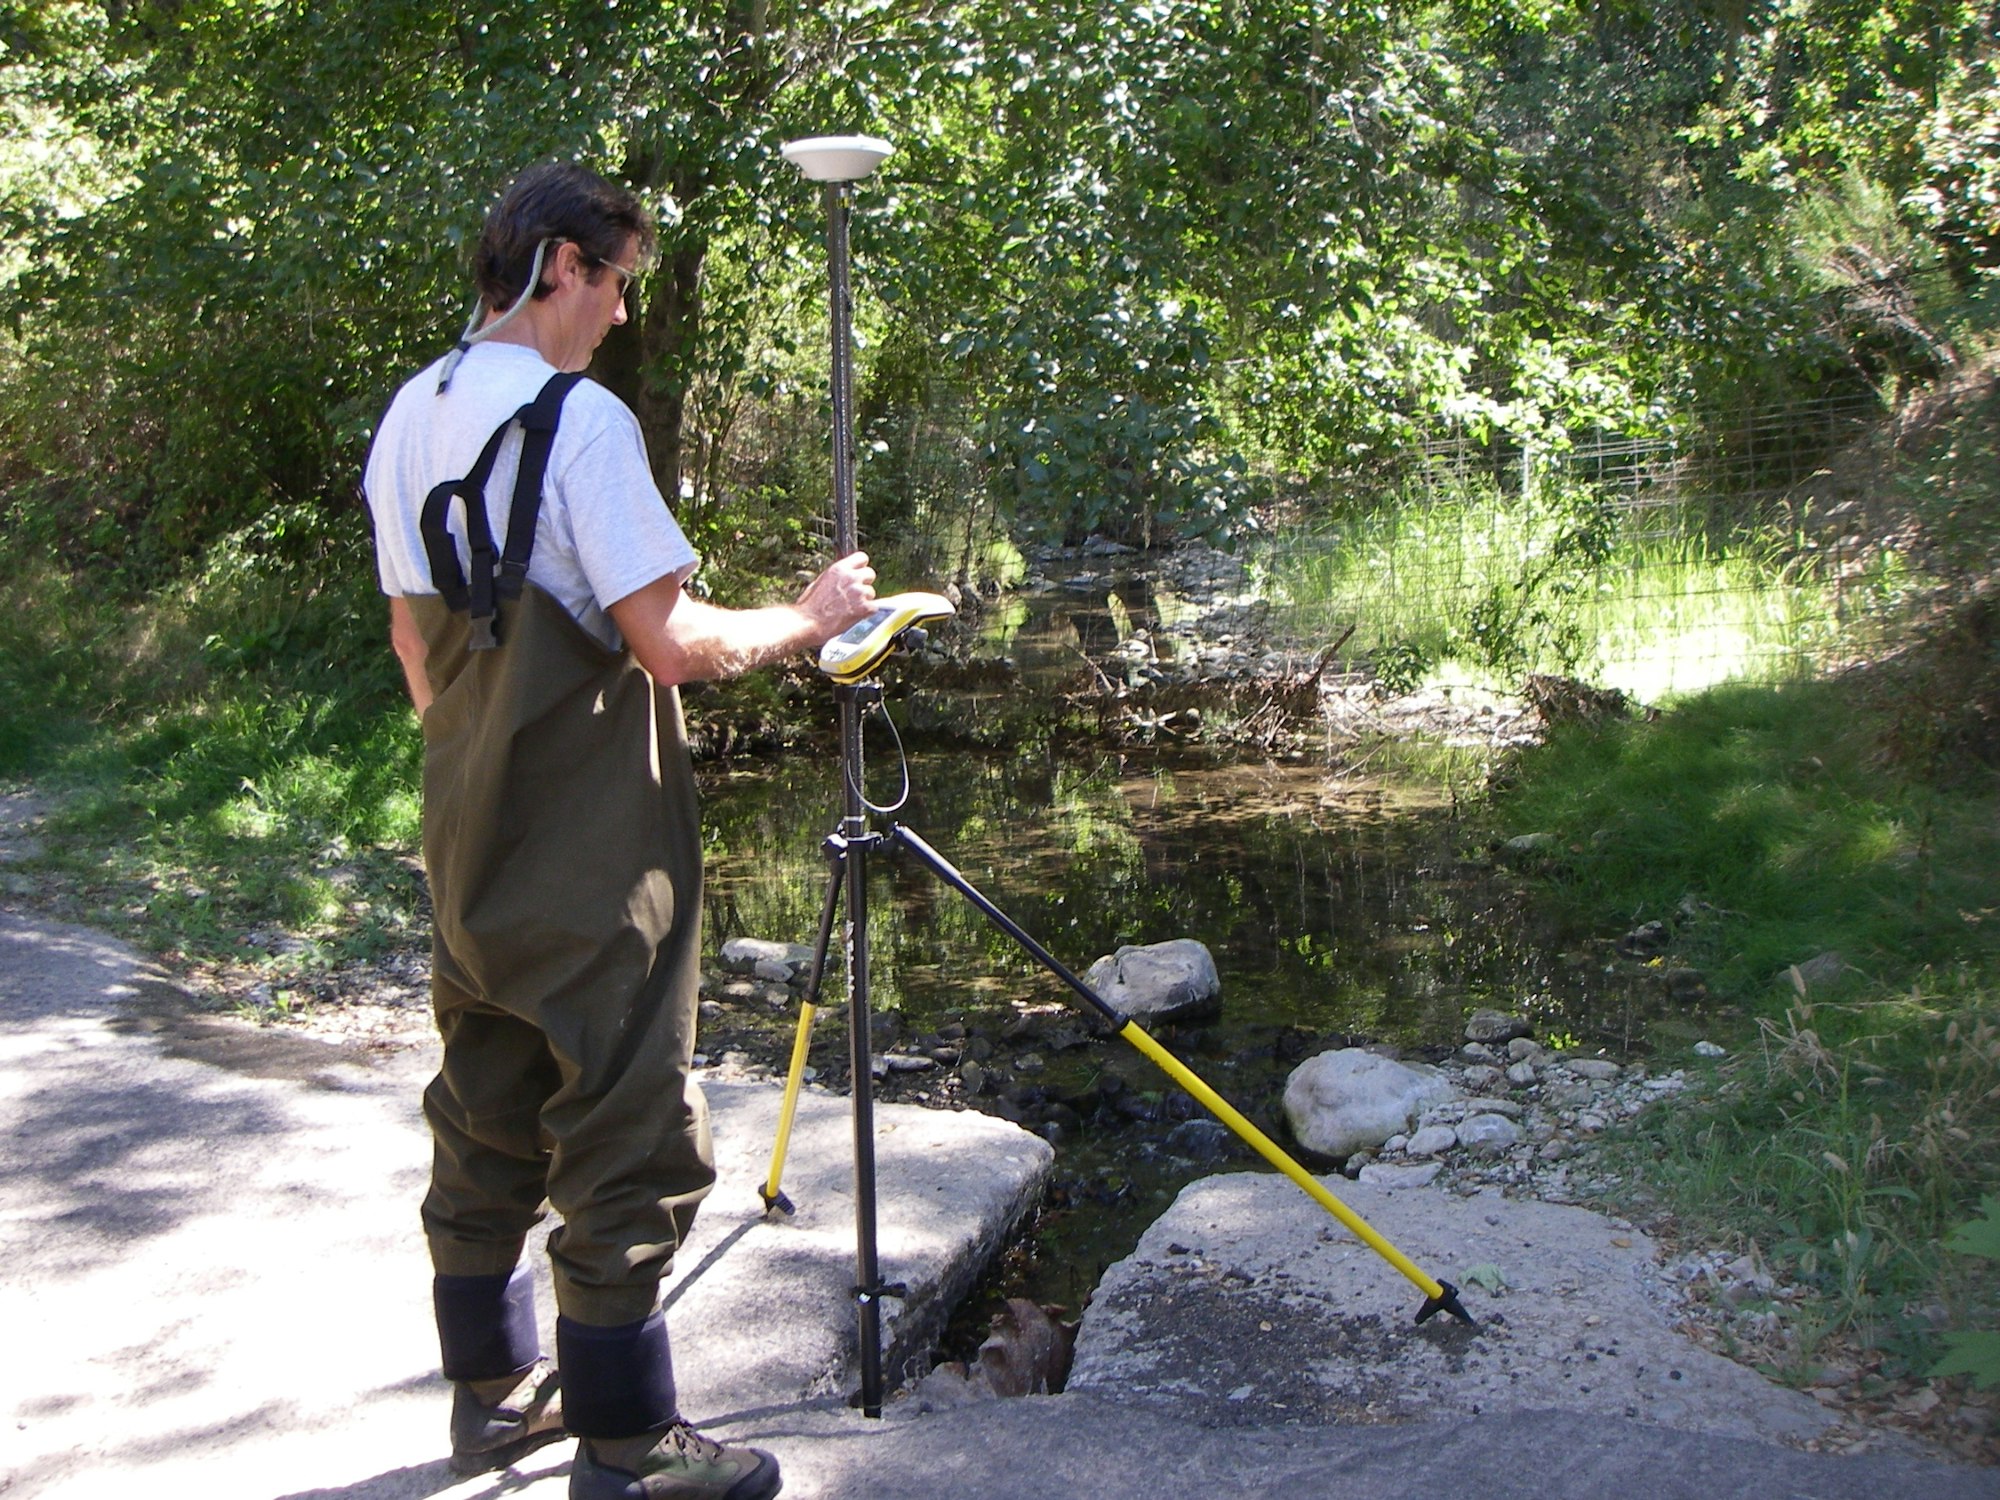
The ability to see trends over time in the same location is what makes GPS so powerful in the Fisheries program. In a river that is constantly changing due to high and low flows, channel migration and deposition, riparian growth and erosion, the one thing that remains constant is latitude and longitude. Collecting GPS coordinates at winter and spring spawning sites allow biologists to revisit the same locations in the summer and fall to determine production and oversummering success. Biologists now have an easier time revisiting the exact same locations to assess fish abundance, water quality and flow in a collective effort to determine whether our activities laid out in the Fish Management Plan are helping to increase steelhead trout abundance in the Lower Santa Ynez river below Lake Cachuma.
Temperature and Dissolved Oxygen (DO) Dataloggers
Since water temperature is a major component of steelhead habitat suitability within the Lower Santa Ynez River, the Cachuma Project Member Units have made this a study priority since the beginning of the project. Two kinds of temperature loggers (Optic Stowaways and Hobos) are deployed in habitats within the mainstem and tributaries in the spring. These small units, about the size of a cigar, continuously collect temperature information every hour and are logged within its internal memory chip until personnel arrive to download them. Although these units have enough memory to capture data for nearly a year, they are downloaded every 30 days to check for accuracy and to make sure they’re still deployed in wetted habitats and in their original location.
The COMB biologists utilize technology (in addition to the temperature loggers) in the form of data sondes to collect a variety of water quality parameters. A sonde is an instrument that can be programmed and deployed in the field to measure multiple parameters in streams at desired intervals. Sondes have several different ports where small measuring devices (probes) can be attached. Each probe measures a different water quality parameter. They can be left in the field for a period of several hours to several weeks, allowing continuous monitoring so that the biologists can examine the data over a wide range of hydrologic and atmospheric conditions. A field computer is used to activate and download the sondes, which is then plugged into a desktop PC for final analysis.
The sondes being used on the Lower Santa Ynez River record temperature, dissolved oxygen, salinity, turbidity, oxidation reduction potential, specific conductance, and pH. Since the temperature and dissolved oxygen concentration of the water are crucial to the survival of steelhead in the river, these parameters are scrutinized and used the most by the project biologists.
To date, biologists are finding that steelhead in the Lower Santa Ynez River appear to be surviving warmer temperatures and lower dissolved oxygen levels than those found in other rivers to the north. This may be an adaptation exclusive to southern steelhead, enabling them to survive in river systems that have historically had lower flows and warmer climates.
Habitat Survey Techniques
Habitat measurements play an important role in fisheries management in predicting such things as the impacts of habitat alterations, potential fish production, and the potential limiting factors to fish populations, survival and growth. They are particularly useful in flashy systems such as the Lower Santa Ynez River basin to show the changes that have taken place during large flow events and how the riparian corridor responds to disturbance over time.
The most basic form of habitat typing can be divided into four distinct categories based on water velocity, depth and substrate composition: pool, run, riffle and glide. The physical habitat within and surrounding the stream corridor is also taken into consideration such as instream cover, bank vegetation, canopy coverage and habitat zone type. Biologists also measure the length, average width, average depth and maximum depth of each habitat unit. Habitat mapping surveys begin at the downstream end of a particular reach and a flow measurement is taken to relate the usable area for aquatic species during that specific habitat survey.
An instrument called a spherical densiometer is used to measure the amount of canopy that is shading a particular habitat. It consists of a concave mirror with 24 – ¼ inch squares engraved on the surface. Each square of the grid is then equally subdivided into 4 smaller squares with a dot in the center of each. The operator can then count the number of dots representing the smaller square areas of canopy openings, and is then multiplied by a standard to obtain the percent of overhead area not occupied by canopy. The difference between this percentage and 100% is the estimated overstory density in percent.
Why is canopy important on the LSYR? Instream canopy, also known as the riparian corridor, provides many benefits for aquatic species inhabiting the river. Canopy provides shade which lowers water temperatures, it provides food sources for steelhead in the form of terrestrial drift and it provides cover from avian predation such as from cormorants and herons. During periods of high streamflow, canopy and instream vegetation can act as a buffer to streambank erosion and will also cause scour and pool formation due to flow restrictions.
Flow Measurements
Current meters
In order to assess how much water is flowing through a particular area, biologists use a current meter called a Marsh-McBirney Flo-Mate. This portable device uses an electromagnetic sensor to measure velocity in a conductive liquid such as water. The sensor is equipped with an electromagnetic coil that produces a magnetic field. A pair of carbon electrodes measure the voltage produced by the velocity of the conductor in the current meter. The measured voltage is processed by the electronics and output as a linear measurement of velocity.
The Flo-Mate is attached to a metal post called a top-setting rod, which has increments of measurement running down the side in tenths of inches. Once an appropriate flow location has been determined, one with laminar flow and even substrate, a tape measure is strung across the water from one bank to another. Typically, 10-20 stations are chosen along the tape and depth and velocity measurements are taken at each position.
Pressure Transducers/Barologgers
The COMB fisheries program also utilizes an instrument called a pressure transducer, which measures the weight of the water above the sensor to then determine the stream stage or depth of the stream above the sensor. When these units are deployed a complete topographic survey of the area is done to get cross-sectional areas that are used to determine a stage-discharge relationship, or otherwise referred to as a rating curve, using well established mathematical relationships and calibration with spot flow measurements at a variety of stages. Once a rating-curve has been determined and calibrated, stage in feet from the pressure transducer can easily be converted to stream discharge in cubic feet per second. These pressure transducers are mounted firmly to boulders or bedrock outcrops, areas that are not subject to streambed alterations at high flows.
In order for an accurate reading, an additional instrument called a barologger is installed in close proximity to the pressure transducer. Barologgers measure changes in atmospheric pressure that in turn is subtracted from the pressure transducer data array to obtain only changes in stream stage.